# assumption-registry-builder
Adopt this skill: https://proskills.md/skills/other/andreworia-claude-excel-skills-skills-assumption-registry-builder
Page: https://proskills.md/skills/other/andreworia-claude-excel-skills-skills-assumption-registry-builder
This document is the public skill bundle for that page. It contains SKILL.md and every helper file the catalog carries. No login is required.
## File: skills/assumption-registry-builder/SKILL.md
size: 8000
upstream: https://github.com/andreworia/claude-excel-skills/blob/main/skills/assumption-registry-builder/SKILL.md
```text
---
name: assumption-registry-builder
description: Creates a structured assumption register for any Excel model with columns for name, category, base value, source, Bull/Bear values, sensitivity rank, and owner, plus a formula for computing sensitivity rank from Data Table outputs.
---
# Assumption Registry Builder
## When to use
Use this skill when a model is complete and needs to be documented for handover, sign-off, or recurring use. Trigger it when a client or reviewer asks "where do your assumptions come from?", when a model needs to be formally approved before a capital allocation decision, when the model will be updated by multiple people over time, or when a business case requires a formal assumption sign-off log. It converts a working model into a fully documented, auditable asset.
## What it does
Produces a structured assumption register: a dedicated Assumptions tab listing every material assumption in the model, with columns for assumption name, category, base value, source and rationale, Bull and Bear values, sensitivity rank (impact on key output), and owner. Includes the formula for computing sensitivity rank using Data Table outputs, and a flag system for assumptions that require active monitoring.
## Method
1. **Define what constitutes a "material assumption."** Not every input in a model needs to be in the assumption register. Material assumptions are: (a) inputs with high sensitivity (top 50% of the tornado chart), (b) inputs that are genuinely uncertain (not based on contractual or regulatory certainty), and (c) inputs that, if wrong, would change the recommendation or decision. Assumptions that are highly certain (e.g., statutory tax rates, known contract prices) still belong in the register but with a "Low" sensitivity rank and "Regulatory/Contractual" source.
2. **Build the assumption register structure.** The Assumptions tab has the following column layout:
Column A: Assumption ID (A001, A002, ... for easy cross-reference).
Column B: Assumption Name (clear label, consistent with the Inputs tab label).
Column C: Category (Revenue, Cost, Capital, Macro/Market, Operational, Strategic).
Column D: Base Value (reference to the Inputs tab cell, not a hardcoded repeat).
Column E: Unit (%, $M, x, #, days, etc.).
Column F: Source/Rationale (text: where did this number come from? Management guidance, industry report, historical average, analyst consensus, benchmarking).
Column G: Bull Value (the favorable assumption value in the Bull scenario).
Column H: Bear Value (the conservative assumption value in the Bear scenario).
Column I: Sensitivity Rank (High/Medium/Low or 1-10 numeric rank based on impact on key output).
Column J: Impact on Key Output (the change in the key output when this assumption swings from Bear to Bull -- computed from the tornado analysis).
Column K: Monitoring Flag (Active/Passive -- Active means this assumption should be revisited at each model refresh).
Column L: Owner (the person responsible for validating and updating this assumption).
Column M: Last Verified Date (when was this assumption last confirmed against reality).
Column N: Notes (any additional context, planned changes, uncertainty flags).
3. **Populate the assumption register from the Inputs tab.** Go through the Inputs tab systematically. For each blue-fill input cell, create a corresponding row in the Assumptions tab. The Base Value column (D) should be a cell reference to the Inputs tab: ='Inputs'!$D$5. This ensures the register always shows the current model value, not a static copy.
4. **Write meaningful Source/Rationale entries.** This is the most important column for audit and sign-off purposes. Acceptable sources: "Management guidance, FY2024 budget presentation", "3-year historical average from audited financials (FY2021-FY2023)", "Industry benchmark: [sector] median from [data type]", "Analyst consensus from comparable public companies", "Contractual: supplier agreement dated [date]", "Estimated based on comparable transaction data." Unacceptable: "Assumed", "Estimate", or blank.
5. **Define the Bull and Bear values.** If a three-scenario model has been built, pull the Bull and Bear values directly from the Scenario Inputs tab: ='Scenario Inputs'!$E$5 (Bull) and ='Scenario Inputs'!$F$5 (Bear). If no scenario model exists, set Bull and Bear values based on the plus/minus range from the tornado analysis. Document the rationale for the range in the Notes column.
6. **Compute the sensitivity rank using Data Table outputs.** The sensitivity rank for each assumption measures its impact on the key model output when it swings from Bear to Bull value.
If a tornado chart Data Table has been built (using the sensitivity-tornado skill), reference the impact values directly from that Data Table.
Impact on Key Output formula: ='Tornado - Data Table'!F_row - 'Tornado - Data Table'!E_row (High impact minus Low impact for this variable).
Sensitivity Rank (1-10, where 1 is most impactful): Use RANK function on the Impact column: =RANK(J5, $J$5:$J$50, 0) where J5 is the Impact column cell for this assumption. A rank of 1 means this is the single most impactful assumption.
Sensitivity Category (High/Medium/Low): =IF(I5<=3,"High",IF(I5<=7,"Medium","Low")) where I5 is the numeric rank.
7. **Sort and organize the register.** Sort by Sensitivity Rank (ascending) so the most impactful assumptions are at the top. Within each rank tier, sort by Category. Add a frozen header row so the column names remain visible when scrolling. Add Excel AutoFilter so users can filter by Category, Owner, or Sensitivity rank.
8. **Add a summary section at the top.** Above the register body, add a summary block:
Total assumptions in register: =COUNTA(A_range)-header rows.
High sensitivity assumptions: =COUNTIF(SensitivityCategoryRange,"High").
Active monitoring assumptions: =COUNTIF(MonitoringFlagRange,"Active").
Assumptions with no source: =COUNTBLANK(SourceRange).
Last full review date: [manually entered date cell].
Reviewed by: [manually entered name cell].
9. **Apply formatting to aid readability.** Apply row banding (alternating light grey and white rows). Apply conditional formatting to the Sensitivity Category column: High = orange fill, Medium = yellow fill, Low = no fill. Apply conditional formatting to the Monitoring Flag column: Active = blue fill. Apply conditional formatting to the Last Verified Date column: red fill if date is more than 90 days ago (=TODAY()-M_cell>90).
10. **Define the monitoring protocol.** For each "Active" monitoring assumption, document: who is responsible for updating it, how often it should be reviewed, and what external data source should be checked. This converts the register into a living document. Add a scheduled review date column: the date by which this assumption should next be checked.
11. **Link the register to the model sign-off process.** Add a "Signed off by" column and a "Sign-off date" column. For a formal approval process, each assumption owner should sign off on their assumptions before the model is presented. The summary block at the top should flag any unsigned assumptions: =COUNTBLANK(SignOffRange). The model should not be presented to a board or investment committee if this count is greater than zero.
12. **Maintain version history of the register.** When the model is updated, update the assumption register. Add a "Previous Base Value" column and a "Change vs. Prior Version" column. This creates an audit trail showing how assumptions have evolved across model versions. The Documentation tab should record each version's change summary.
## Inputs
- List of all model inputs from the Inputs tab (names, values, units)
- Source or rationale for each assumption (management guidance, historical data, benchmarks)
- Bull and Bear values for each assumption (from scenario model or tornado analysis)
- Impact on key output for each assumption (from
```
## File: README.md
upstream: https://github.com/andreworia/claude-excel-skills/blob/main/README.md
```text
Built by Oria
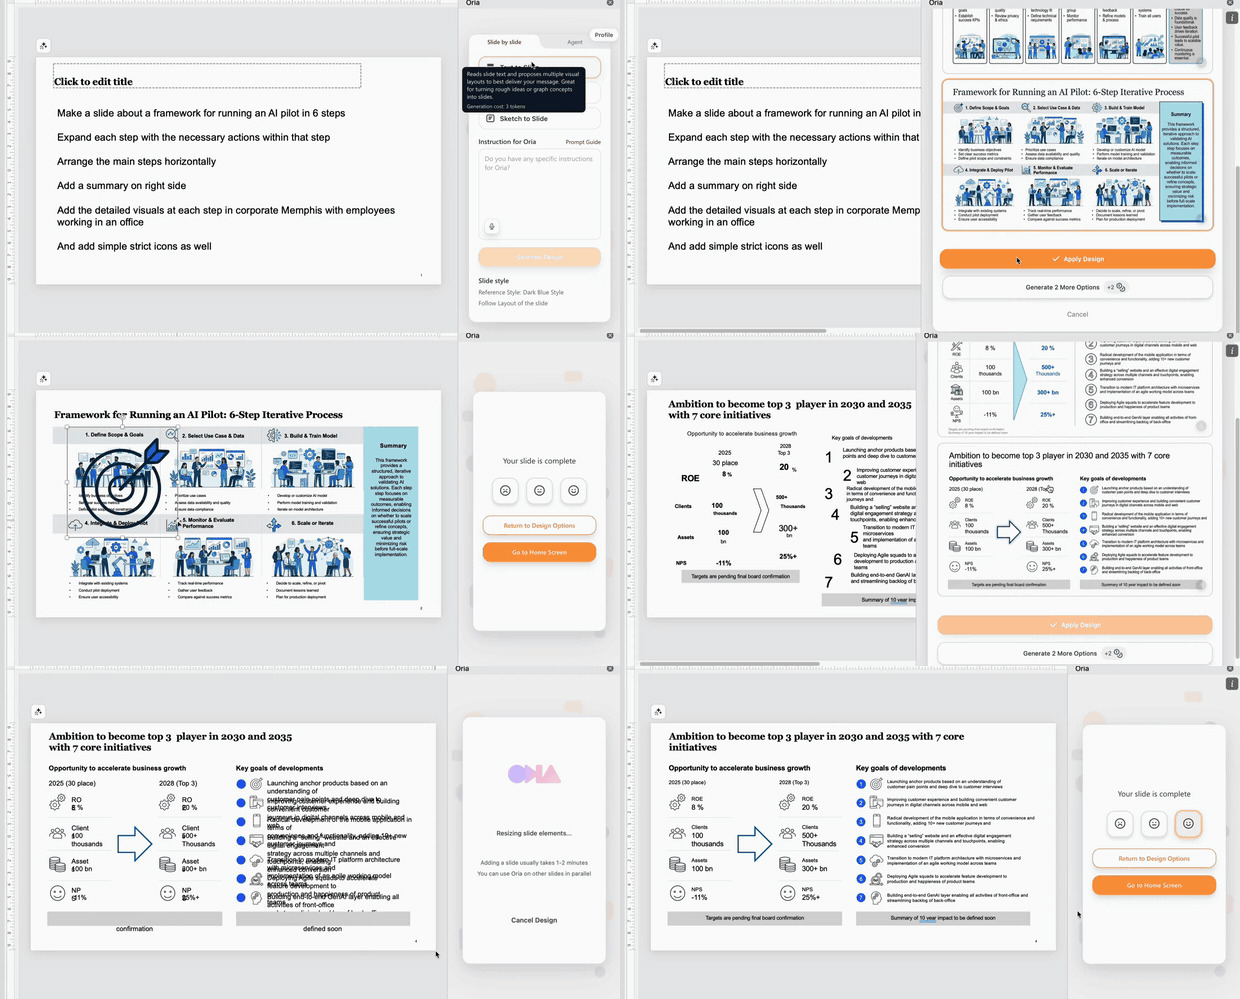
Build Professional Slides That Do Not Feel Like AI
Consulting-grade complex slides that follow the exact look and feel of your company.
Made for consultants, bankers and strategy teams who build boardroom-style decks
inside PowerPoint, Claude and ChatGPT.
Create stunning slides in PowerPoint — and CEO-ready documents in Claude and ChatGPT
### What Oria does
| | Feature | What it means |
|:--|:--|:--|
| **01** | **Slides that do not look AI-generated** | None of the boxy, template-stacked look. Layouts structured to consulting standards. |
| **02** | **Multiple design options with one click** | Compare distinct design options instantly. Never settle for a single default draft. |
| **03** | **Precisely follows the brand** | Well beyond base colours and fonts — your firm's exact look and feel. |
| **04** | **Fully editable, native output** | Real PowerPoint shapes, never images. Refine every element as you always do. |
**Built for every slide scenario** — turn rough ideas, an audio note or a brain dump into CEO-ready slides · paste structured output from Claude or ChatGPT and get polished designs · upload an existing slide and get a cleaner one back · snap a photo of handwritten notes and get fully editable slides.
**Enterprise-grade security** — zero data retention, working artifacts self-destruct within one hour · Oria does not use your content to train or fine-tune models · enterprise agreements with leading AI providers · fully private cloud or on-premise deployments.
> "I've been looking for AI tools to create PowerPoint slides. The best one I've found so far is **Oria**."
>
> — **Will Bachman**, Founder and CEO of Umbrex, Global Community of Top-Tier Management Consultants
---
# Claude Excel Skills
**12 Claude skills for building financial models and clean workbooks that survive a review.**
These cover the discipline behind a model that someone else can open: a tab structure agreed before the first formula, inputs separated from calculations, a driver-based revenue build, a scenario toggle you can actually audit, and a formula check run before the model reaches an investment committee. Underneath it all is the unglamorous part — cleaning the pasted export and pivoting it — because that is where most models really start.
Several of these skills build a real `.xlsx` from scratch through Claude using `openpyxl`, with live formulas and a recalculate-and-verify pass, and hand you the file. They say so explicitly, and they say equally explicitly that they are **not** the Claude for Excel add-in. The rest are method skills: structure, conventions and audit routines that make Claude reason about a workbook the way a modeller does.
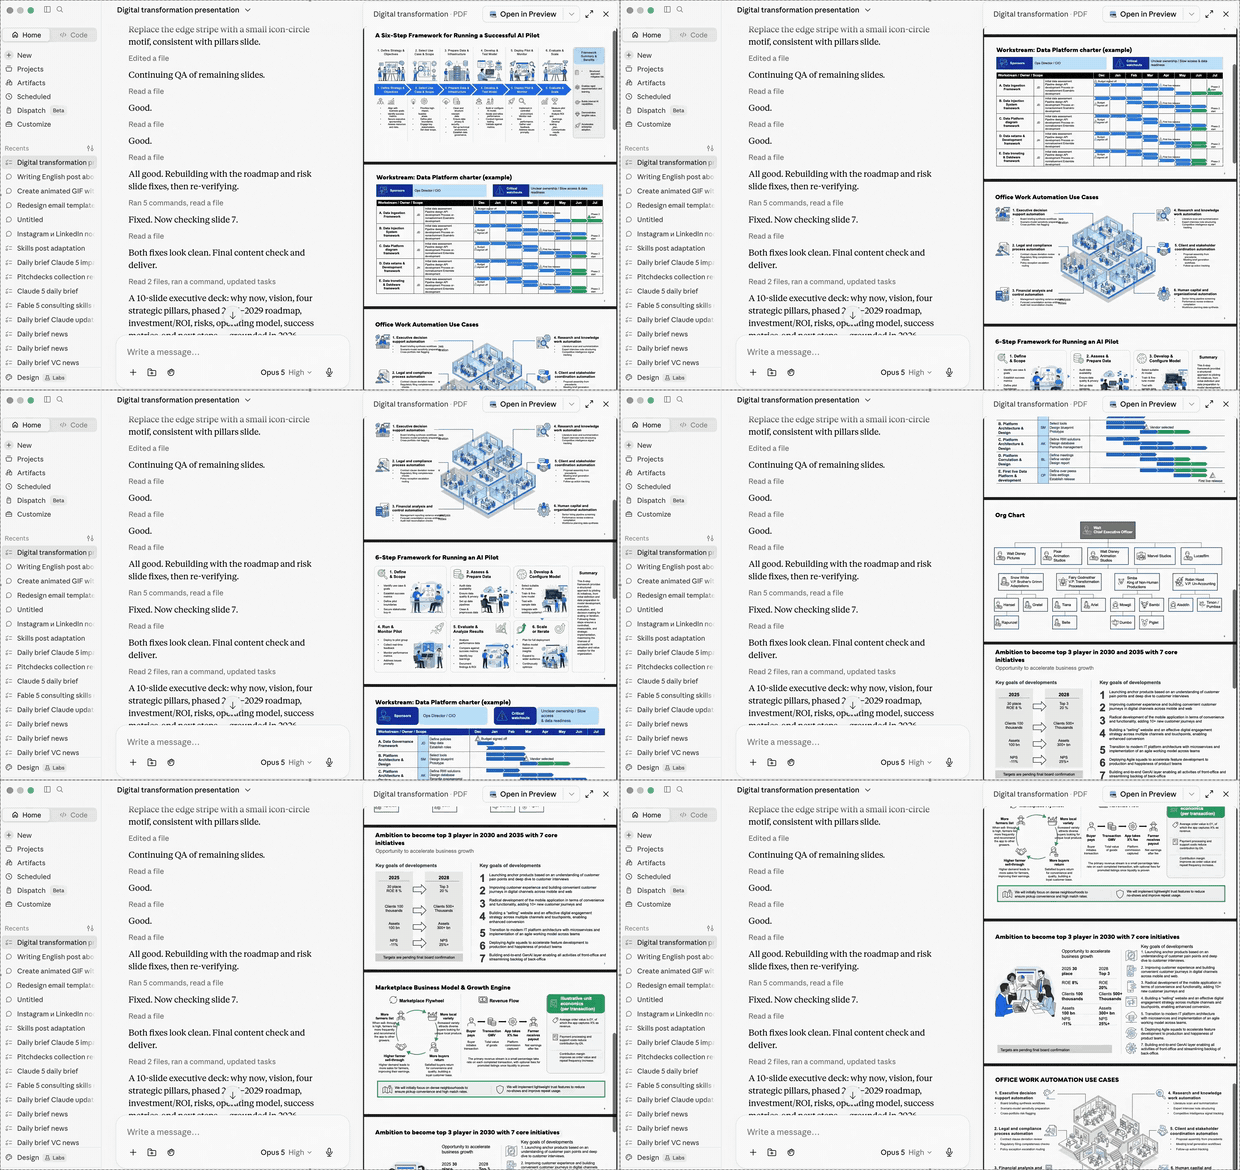
They were written by [Oria](https://www.oria.one/?utm_source=github&utm_medium=readme&utm_campaign=claude-excel-skills) and published free. Oria is not an Excel tool — it is what happens after the model is finished, when the output has to become a board-ready exhibit.
## The skills
### Structure — lay out the workbook before a formula goes in
| Skill | What it does |
|:--|:--|
| [`model-architecture-template`](skills/model-architecture-template) | Sets the master tab set, naming conventions, colour codes, number formats and print setup for a new model — the empty shell every other skill fills. |
| [`inputs-calcs-outputs-design`](skills/inputs-calcs-outputs-design) | Enforces the three-zone separation: an Inputs tab of editable assumptions, Calculation tabs with no hardcodes, and an Outputs tab that only references. |
| [`assumption-registry-builder`](skills/assumption-registry-builder) | Builds the assumption register — name, category, base value, source, Bull and Bear cases, sensitivity rank and owner — so every number has a provenance and a signature. |
### Build — clean the data, then drive the numbers
| Skill | What it does |
|:--|:--|
| [`data-cleaning-for-excel`](skills/data-cleaning-for-excel) | Turns a pasted export with mixed date formats, text numbers, duplicates and stray whitespace into a consistent range, with a change log so the cleaning is auditable. |
| [`pivot-table-builder`](skills/pivot-table-builder) | Specifies and builds a pivot from a flat range — rows, columns, values, filters — and flags the fields that will not aggrega
```